Gage R&R sheets - What do EV & AV mean?

New to statistics

Involved In Discussions
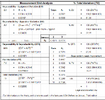
Focus on the results outlined in red. These are the basis for the numerator of all the metrics and are most likely to be calculated incorrectly by a spreadsheet. Then verify the Total %SV, Total %Tol and Total %Contribution to be safe. This is to verify that the denominators are correct.

For the same values i attached the output of spreadsheet and Minitab
Gage R&R sheets - What do EV & AV mean?

Gage R&R sheets - What do EV & AV mean?

Is this difference important? how much slide is "acceptable" between those two?
At the end which method we prefer as more objective?

Thank you again.
 

Attachments

  • Gage R&R sheets - What do EV & AV mean?
    1716360218247.png
    43.8 KB · Views: 10

Miner

Forum Moderator
Leader
Admin
You have a number of issues going on in this case. First, the Excel template is using the Xbar/R calculations while Minitab is probably using ANOVA (which is the default) unless you manually specified the Xbar/R method. That alone can account for the differences. If you are simply wanting to validate the results of the template, rerun the Minitab analysis using the Xbar/R calculations.

Your question pertaining to how much of a difference is acceptable is very complicated. Obviously, the two different methods give different results because the Xbar/R is an approximation. Historically, this difference has been accepted without further comment. Also overlooked is the fact that both methods are based on relatively small samples and can have large confidence intervals around the results. There have been no published studies on this topic and no guidance given.
 

Bev D

Heretical Statistician
Leader
Super Moderator
If you just plot either the Xbar R chart and/or the Youden plot you will SEE the results and then you can THINK about what all that math means. It will help you learn.
 

New to statistics

Involved In Discussions
Miner
How you notice that the spreadsheet run xbar r Method? I can attach the file if you wish

Bev
I try to graph the data as you always mention and you can see thing's that equations can't say
A question for you: is it possible to make a youden plot for more than 2 trials per appraiser?
 

Bev D

Heretical Statistician
Leader
Super Moderator
Bev
I try to graph the data as you always mention and you can see thing's that equations can't say
A question for you: is it possible to make a youden plot for more than 2 trials per appraiser?

No. Scatter diagrams are 2 dimensional. You don’t need 3 repeats. The whole point of repeats is to estimate the measurement error standard deviation. An extra repeat does not substantially improve that estimate. More parts (>10) does improve the measurement error SD estimate. (This is basic statistical estimation theory).
 
Top Bottom